In my first blog post, I reviewed what Backup Eagle was and how it can monitor your environment. I also went through the installation process as well. Part 1 can be found here -
Monitoring with BackupEagle - Part 1
The company graciously granted me an NFR license to test within my homelab - Backup Eagle by Schmitz RZ Consult GmbH.
In this post, I am going to cover the Administration Console, including things like -
- Installing a license file
- Adding servers for monitoring
- Dashboards
- Reports
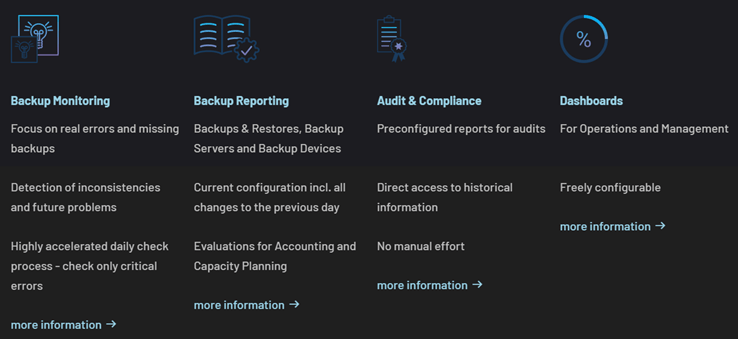
Backup Eagle is used for Backup Monitoring, Reporting, and Audit & Compliance.
Launching the console is very straightforward; double-click the desktop icon " BACKUP EAGLE Administration Client," which launches the console. You can see the console when it first opens below (keeping in mind I already have data showing - a new installation will not have any data until you add servers).

After you get into the dashboard within the Administration Console, you need to configure a license and set up servers to monitor. To install a license, which is an XML file you will receive, click the Settings menu and select License Management, which brings up the License Management dialog.
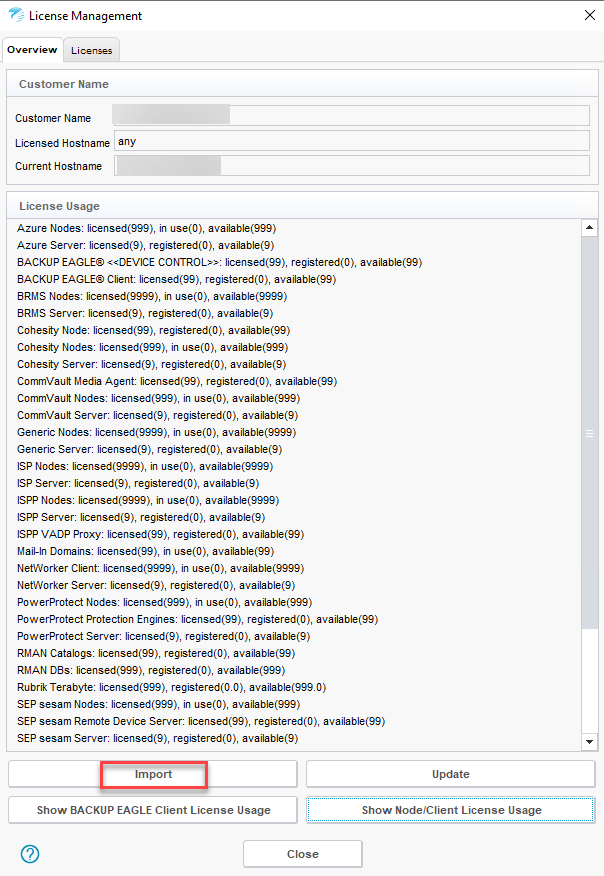
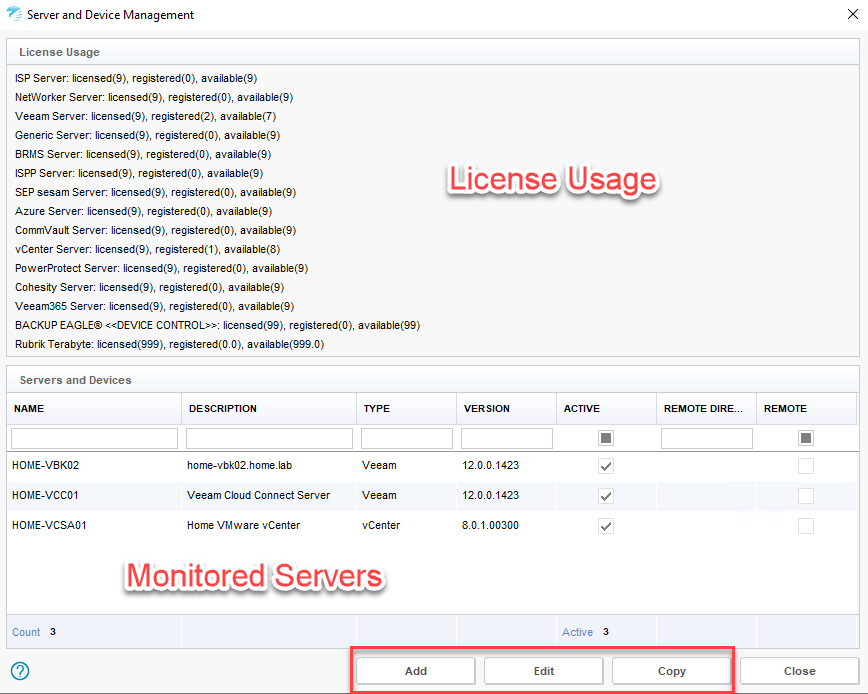
After you import the license XML file, you will see the products you are licensed for in the dialog. My license is an NFR with all available products, so there is more to the list, like Veeam, etc., below SEP. The next step is adding servers for the licensed products to your console. To that, we click again on the Settings menu and select Server and Device Management. This will bring up a dialog showing licensing in the top part of the window and the servers you add in the bottom half.
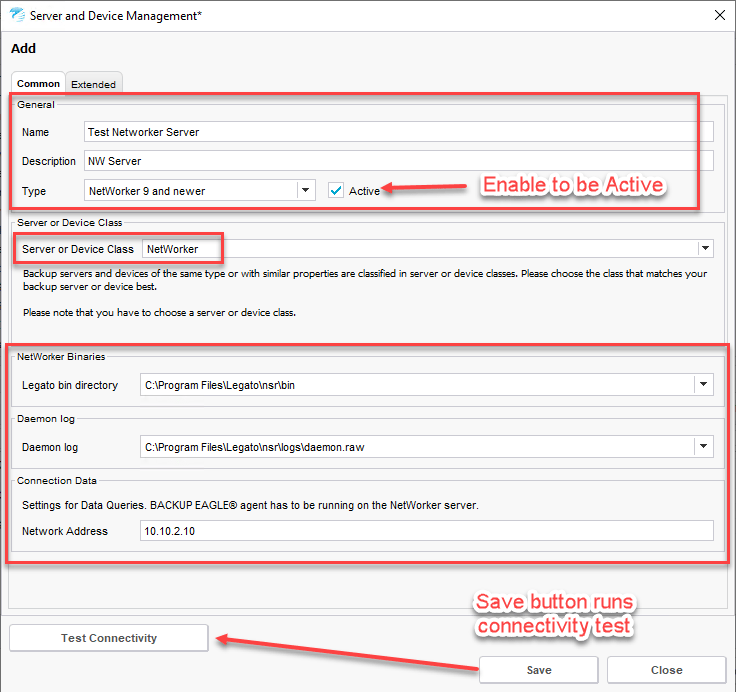
At the screen above, you click the Add button, which brings up a dialog to enter information regarding the device you will monitor and what type it is based on your licensing. Once done, Save the new device/server, which conducts a connectivity test, and click the Close button. Your device/server now shows up in the dialog for Server and Device Management; you can click Close.
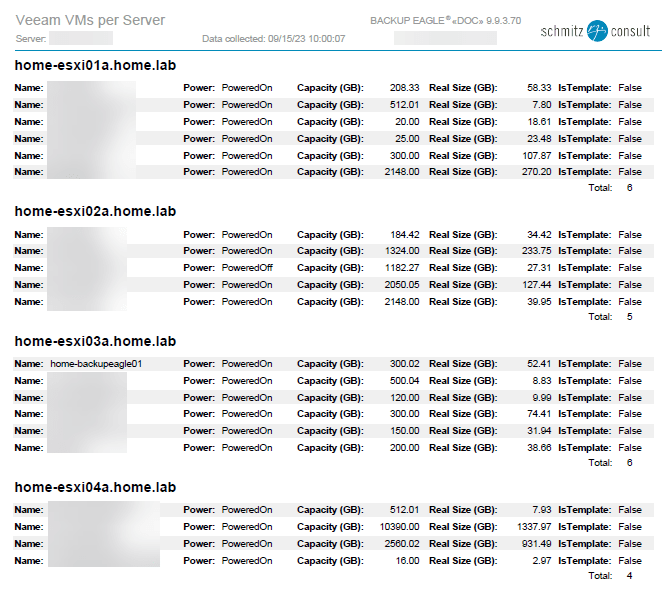
Once you have given the system time to collect data, you can view the information by navigating the console. One of the tabs is Reporting, which has abundant reports and documents you can view, email, and print based on your environment data collected. I will show an example of a Veeam report, which I mainly monitor in my lab environment.
When you are in the console, you click the Reporting button in the ribbon, and then you can filter reports based on Veeam by clicking the “V” icon. This will bring up anything Veeam-related and show you Documents (DOC) and Reports you can schedule and run. Below is the console showing the reports and also a sample document. While I am just touching on the Reporting tab, there is so much more you can do with it when using multiple products that Backup Eagle supports.

I hope that you have found the information in this blog post useful.
You can find out more about Backup Eagle on their website here - https://www.backup-eagle.com
In my next post, I will explore the console more, investigate collected data, and view more detailed reports and other options available. So stay tuned!